
Final Meta-LAM Dashboard for Teachers
Final Meta-LAM Dashboard for Teachers

The meta-LAM dashboard for teachers was developed to provide teachers information of the students actions taken in the games and mini-games in the BEACONING platform. The dashboard was developed to meet the specific needs of BEACONING including games and mini-games structure and location-based activities. The dashboard definition is based on two previous concepts: the Learning Analytics Model (LAM) and the meta-LAM.
The Learning Analytics Model (LAM) describes which data is to be collected for a particular educational videogame and how this data should be processed, reported, and interpreted. A complete LAM definition includes specifying the learning goals, game goals, traces to be sent, analysis model, visualizations and alerts and warnings if needed. For more details about the Learning Analytics Model, see the blog post about it.
The meta-LAM is required for situtations when a game is composed of multiple games (each with their inidividual LAMs). For those scenarios, meta-LAMs stitch together the LAMs of the individual games and define how they are to be joined together. The structure for the meta-LAM is based on a a simplified version of the IMS Simple Sequencing specification as described in SCORM 2004 4th Edition Sequencing and Navigation (SN) specification. For more details about the meta-LAM, see blog post about it.
The teacher dashboard contains 5 sections:
-
General: This sections displays global information, including:
-
-
Students list
-
Total sessions
-
Games initialized and completed
-
Time picker
-
-
Answers: This section displays visualizations related with minigame answers, including:
-
Total answers of all students
-
Questions answered (correct and incorrect)
-
Percent of answers per minigame (correct and incorrect)
-
-
Scores: Game and minigame scores displayed along their averages by student, including:
-
Average score of all students in all games
-
Average score per student
-
Scores per player
-
-
Progress and duration: This section contains visualizations related with game progress and completion times, including:
-
Game and mini-games progress per player
-
Average progress over time
-
Time to complete each activtiy (minimum, average and maximum times)
-
-
Location: This section contains visualizations for location-based games, including:
-
Heat map
-
Time to reach each POI (minimum, aveage and maximum times)
-
The dashboard is described in detail in its GitHub wiki page.
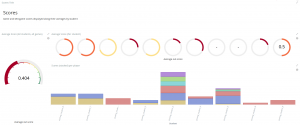
Figure 1: Scores section of the dashboard, displaying information from games and mini-games.
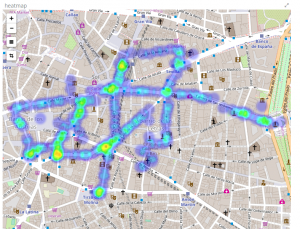
Figure 2: Heat map of the dashboard, displaying information from location-based activities.